Debunking the perplexingly advanced, cutting-edge technologies used by researchers at the Ragon Institute Imaging Core in pursuit of an HIV/AIDS vaccine.
There is perhaps no better analogy for the Ragon Institute of Mass General, MIT, and Harvard’s Imaging Core than a tricked-out, time-traveling 1985 DeLorean sports car.
Yes, you read that correctly.
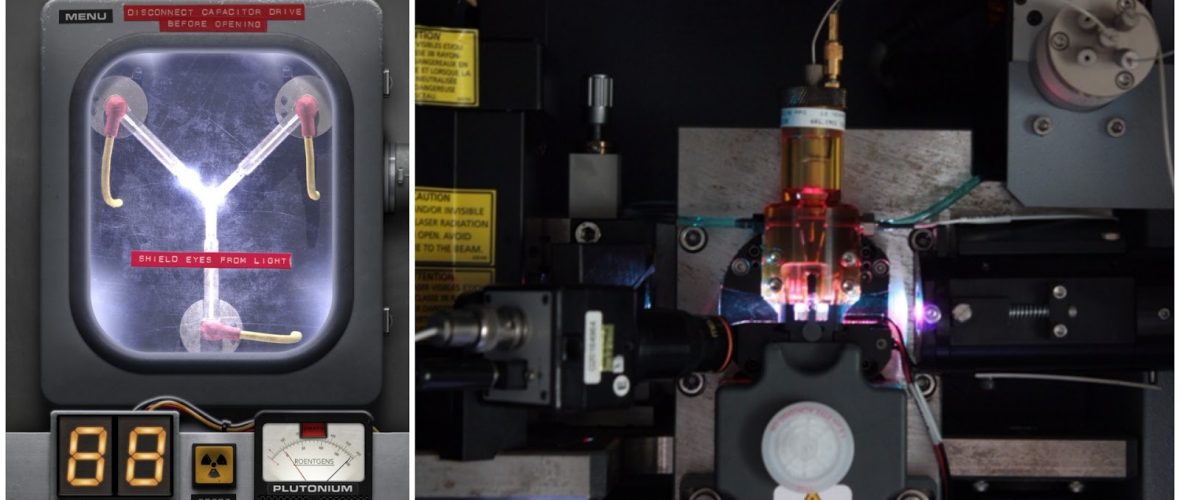
Much like Marty McFly’s temporally protean vehicle in Robert Zemeckis’s classic sci-fi comedy Back to the Future, the Ragon Institute’s Imaging Core is built on decades of scientific research and maintained by electrifyingly smart and engaging scientists including Galit Alter, PhD., Director of the Ragon Imaging Core, principal investigator of the Alter Lab, and Associate Professor in medicine at Harvard Medical School, Thomas Diefenbach, PhD., Associate Director Ragon Imaging Core (Microscopy) and Senior Research Scientist in microscopy at Massachusetts General Hospital, and Mike Waring, Associate Director (Flow Cytometry) of the Ragon Imaging Core. Furthermore, Zemeckis’s dystopian sports car and the Ragon Imaging Core both house multiple perplexingly advanced machines ranging from the flux capacitor (above, left, bttf.net) to the flow cytometer (above, right).
Although time-traveling DeLoreans remain elusive to the modern scientific community, cutting-edge machines such as flow cytometers and laser scanning confocal microscopes are used by scientists every day at the Ragon Institute.
In the pursuit of an HIV/AIDS vaccine, scientists need to be able to rapidly characterize cell populations which exist in fluids, such as human blood, in order to decipher how those millions of cells differ from one another. One way to elucidate these subtle differences between cells is to look for different proteins on the surfaces of the cells, and mark them in a way that makes them detectable. This is where flow cytometry comes into play.
Fundamentally, flow cytometry is the measurement (metry) of cells (cyto) as they flow through a liquid suspension one at a time. Originally coined “pulse cytophotometry” in 1968 by Dr. Wolfgang Göhde, flow cytometry is a technique used by researchers to identify and quantify different types of cells by passing them in front of a laser beam. Flow cytometers measure the physical and chemical properties of millions of cells depending on the direction that the laser light is scattered when it strikes and goes through the cells and the color of the light that is emitted by cells stained with fluorescent markers for specific proteins of interest.
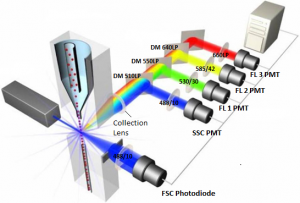 Flow cytometers are comprised of four systems—a fluidics system which organizes the cells into a single file line and shuttles them in front of the laser beam, an optics system which generates the laser beam, aims it at the stream of cells, and filters the scattered light, an electronics system which turns the light signals into numerical data, and a computer which uses software to process the numerical data. The image to the left displays all four systems of a flow cytometer working together (labome.com).
 Once a liquid sample is loaded into a flow cytometer, the machine uses pressurized air to send the fluid to the flow cell. Inside the funnel shaped flow cell (pictured right, umich.edu), sheath fluid (usually saline) flows at a much faster rate than the sample fluid. In a process called hydrodynamic focusing, the sample fluid is injected into the middle of the flow cell and compressed until the cells flow in single file. The thin stream of cells then passes through one or more lasers (up to five) before being discarded. The point where the cells pass in front of the laser beam, the interrogation point, can be either inside of the flow cell or in the jet of cells exiting the flow cell. After passing through the interrogation point, cells can either be discarded or sorted.
When a cell passes through the interrogation point it scatters light differently depending on the size, internal complexity, and refractive index of the cell. The light that is scattered directly in front of the cell is called the Forward SCatter (FSC) and is used to measure the size of the cell. Due to their greater size, bigger cells have more FSC than smaller cells. FSC also depends on the cell’s refractive index, which describes how light is bent as it travels through the cell.
 The light that is scattered to the side of the cell is called Side SCatter (SSC) and is typically collected at a 90 degree angle to the laser beam. SSC occurs when the laser beam bounces off particulates inside of the cell such as organelles and DNA. Thus, SSC measures the granularity (internal complexity) of the cell. After a population of cells is assayed, a dot plot of size (FSC) vs. internal complexity (SSC) can be created. Cells with similar size and internal complexity clump together on the graph revealing the different sub-populations of the sample (lymphocytes, monocytes, and granulocytes from a sample of human leukocytes pictured right, wiley.de).
In addition to measuring FSC and SSC, flow cytometers can measure the amount of light emitted by a fluorescent marker when it is excited by a laser beam. In order to further classify cell populations of a similar phenotype (i.e. cells of a similar physical appearance such as B and T lymphocytes), cells can be stained with monoclonal antibodies (proteins which bind to only one other protein) that have been tagged with fluorophores (chemical compounds which can absorb and emit light).
When fluorophores are “excited” by light, their electrons absorb the incoming photons (quantum particles of light) causing them to jump up to higher energy levels. As electrons fall back down to lower energy levels, some of this energy is lost in the form of heat and vibration. Thus, when the electrons return to their ground state, they release photons of slightly less energy. This decrease in energy causes the light that is emitted to be a different color than the light that is absorbed.
Photons demonstrate a property called wave-particle duality, meaning even though photons are considered “particles of light” they also behave as waves. Wavelength is simply the distance between two adjacent crests in a wave of light and is the property that defines different colors of light. Wavelengths range from 100 meters (AM radio) to 0.0001 nanometers (gamma rays). The colors our human eyes can see range from about 390 to 700 nanometers (nm).
 There are hundreds of different fluorophores on the market today, each one absorbing and emitting light at very specific wavelengths. For example, the fluorophore “Per-CP” absorbs light between about 350nm and 600nm and emits light between about 650nm and 700nm. Per-CP absorbs light best at 472nm and emits light most strongly at 677nm. The difference between the two peaks is called the Stoke’s shift for the fluorophore. The absorption and emission spectra of Per-CP are pictured on the left (jacksonimmuno.com). Researchers can identify and quantify different types of cells using monoclonal antibodies tagged with fluorophores of different excitation an emission spectra. The differing excitation and emission spectra mark the molecular fingerprint for that specific fluorophore.
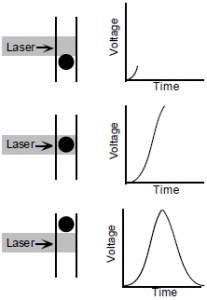 All cells in the body have different combinations of proteins present on their surface. This property allows scientists to manufacture monoclonal antibodies tagged with fluorophores that are able to bind specifically to proteins of interest. Therefore, these proteins of interest can be identified using a flow cytometer to expose the tagged cells to a laser beam (a beam of light containing only one wavelength, unlike white light which contains several different wavelengths) or multiple laser beams set to wavelengths within the excitation spectra of the fluorophores, and then measuring the emitted light with filters designed to collect wavelengths of light only within the emission spectra for those fluorophores. This data is collected in the form of voltage impulses (shown on the right, labome.com) which are then processed using a computer program to convert the impulses to numerical data. The most precise way to interpret an impulse is to take its integral (area underneath the curve).
For example, a researcher could take a sample of human peripheral blood mononuclear cells (PBMC’s) and stain them with the anti-CD4 monoclonal antibody labeled with the fluorophore FITC and an anti-CD8 monoclonal antibody labeled with with fluorophore PE. CD4 and CD8 are two types of cell surface proteins for a type of white blood cell called lymphocytes. If a lymphocyte has CD4 surface proteins it is a helper T cell and if a lymphocyte has CD8 surface proteins it is a cytotoxic T cell. Once the cells are stained, they can be run through a flow cytometer. Then, using an external software the researcher can construct a graph of FSC versus SSC in order to isolate the lymphocytes from the sample of PBMC’s (image at bottom of page 2).
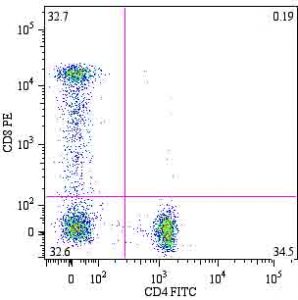 The researcher can then gate on (select) the lymphocytes specifically using the software and create a dot plot of the fluorescence of FITC versus PE (pictured right, abcam.com). Because we know that FITC binds to CD4 and PE binds to CD8, we can conclude that the cells in the top left quadrant are cytotoxic T cells (high in CD8, low in CD4), the cells in the bottom right are helper T cells (low CD8, high CD4), and the cells in the bottom left are negative for both CD4 and CD8.
Due to the incredible customization of flow cytometers, the machines are used extensively across the field of medicine and biomedical research in immunology (histocompatibility crossmatching, transplantation rejection, HLA-B27 detection), oncology (DNA content and S phase of tumors, DNA Measurement of proliferation markers), hematology (leukemia and lymphoma phenotyping, hematopoietic progenitor cell enumeration, diagnosis of systemic mastocytosis), blood banking (immunohematology, assessment of leukocyte contamination of blood products), assessing genetic disorders (PNH, leukocyte deficiency disorders), and cell sorting.*
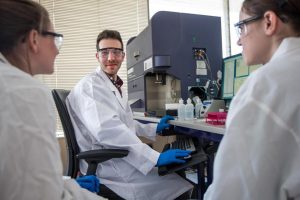 Supervised by Mike Waring, the flow cytometry division of the Ragon Imaging Core houses five different analysis flow cytometers in a biosafety level 1 (BL1) facility, each equipped with 2 to 5 lasers and capable of measuring up to 18 different colors, as well as two cell sorting flow cytometers which enable researchers to collect cells of interest after passing through the interrogation point instead of discarding them. Ragon’s BD SORP FACSAria cell sorter is housed in a biosafety cabinet allowing for safe processing of infectious samples and the AutoMACS Pro cell separator is located in a BL3 lab which can process “indigenous or exotic agents that may cause serious or potentially lethal disease through the inhalation route of exposure” such as tuberculosis (cdc.gov). Pictured left, Taylor Hickman, Enrique Martin-Gayo, and Morgan Demmler look at images from a flow cytometer (image from Aram Boghosian for the Boston Globe).
Though flow cytometry is an excellent technique to analyze and sort large cohorts of cells very quickly (up to 100,000 cells per second), it lacks the ability to visually inspect individual cells. This does not present an immediate problem for cells like erythrocytes (red blood cells) which naturally thrive in solution, but it does present a problem for the vast majority of cells in the human body which exist in solid tissue.
After the initial infection HIV can lay dormant in the body for years in the DNA of certain cells called HIV reservoirs. These reservoirs can exist anywhere from the brain to bone marrow. Microscopy enables researchers to “hunt” for these reservoirs by taking biopsies from common sites of HIV infection and progression such as the cervix, colon, and lymph nodes. Thus, microscopy allows scientists to view individual cells and tissues in great detail in their original context, not just fixed in solution like in flow cytometry.
In addition, unlike flow cytometry which is suited to analyze large populations of cells, scientists can observe the internal workings of individual cells using high-power microscopes. In a process called localization, researchers can track changes in protein location, gene expression, and even ion/second messenger concentration.
Modern 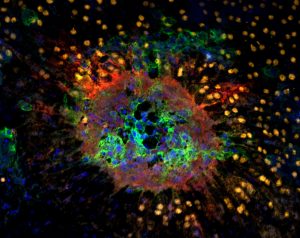 microscopes often come equipped with a high-speed digital camera which can capture images of individual cells. By combining localization with the additional dimension of time, scientists can create both long term time lapse videos of slow cell processes such as cell division as well as slow motion videos of almost instantaneous cell to cell interactions such as the release of neurotransmitters. (Images courtesy of Thomas Diefenbach).
Dr. Thomas Diefenbach manages the microscopy division of the Ragon Imaging core which encompasses five imaging systems, including a Zeiss LSM510 laser scanning confocal microscope and a fully automated Zeiss Axio Observer microscope, both housed in BL2+ compliant facilities. These imaging systems are therefore fully equipped for both fixed and live cell, time-lapse imaging. In addition, the facility has two slide scanning systems (MIRAX MIDI and TissueFAXS) housed in a BL1 facility for high speed automated imaging and cellular screening of tissue sections and cultured cells on glass slides.
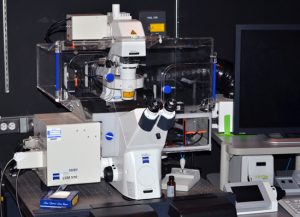 Laser scanning confocal microscopes (Zeiss LSM510 confocal microscope, pictured left) are different than traditional microscopes because instead of using white light or a fluorescent light source to illuminate a specimen, LSCM’s use lasers to excite fluorophores within or on the surface of a specimen—making it possible to observe even the most discrete units inside of a cell, such as tiny groups of surface proteins, at high resolution.
The LSCM contains a tiny hole in the emission light path called a spatial pinhole which filters out scattered light due to out of focus fluorescence coming from the plane of the sample. In this way, LSCM’s only let light through the pinhole that is coming directly from the focal plane of the sample and block light from entering the lens from above and below the sample. As a result of blocking out of focus light from entering the pinhole, LCSM’s are only able to visualize thin optical sections of cells/tissues—allowing researchers to take high resolution/high contrast micrographs (pictures taken using a microscope) that would not be possible using a traditional microscope.
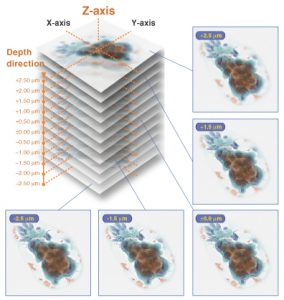 Furthermore, unlike traditional microscopes which detect everything as far into the specimen as light can penetrate, LSCM’s have a highly limited depth of focus which captures images one depth level at a time precisely with high resolution and specificity. Similar to how many slices of a chopped apple can be stacked on top of each to resemble a complete apple, researchers can take the collection of micrograph “slices” of a sample called a Z-stack (pictured right, hamamatsu.com) and stack them on top of another to create a three dimensional (3D) representation of the cell or tissue.
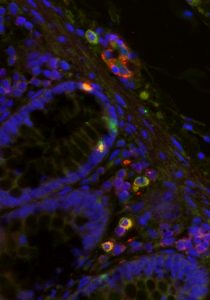
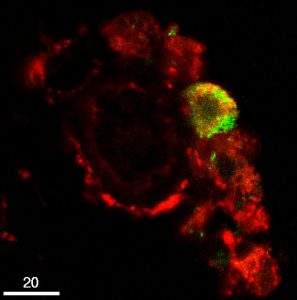 Such 3D models can be manipulated to precisely locate where specific organelles, proteins, and processes are occurring within the cell or tissue. By combining time lapse imaging of live cells/tissue with LSCM’s unparalleled optical specificity, scientists are able to to observe how individual cells change over time, including cell migration and motion, cell-to-cell interactions, and changes in protein localization. Pictured to the left is a micrograph taken using a laser scanning confocal microscope of a perivascular RCA-1 stained macrophage (red) being infected with HIV labelled with green fluorescent protein (aidscience.org).
The two contrasting yet complementary assays of flow cytometry and microscopy constitute the backbone of the Ragon Institute of Mass General, MIT, and Harvard’s Imaging Core—enabling researchers to examine cells at both the population and individual cell level. Just like Marty McFly’s time-traveling DeLorean is incomplete without a flux capacitor, each technology contributes essential information to the collective study of biochemistry, medical physiology, and molecular biology. Apart from providing access to imaging and flow cytometry platforms, the Ragon Institute Imaging Core ensures that users are provided professional consultation on topics related to advanced imaging applications, experimental design, image analysis, and sample preparation. As a Massachusetts General Hospital core facility in collaboration with the Massachusetts Institute of Technology and Harvard University, the Ragon Institute Imaging Core serves the extended MGH, MIT, and Harvard community and welcomes all visitors from research institutions within the greater Boston area.
For more information on the Ragon Institute’s services, equipment, and rates, contact:
Dr. Galit Alter, Ph.D.
Director, Imaging Core
Email: galter@partners.org
Mr. Michael Waring
Associate Director Imaging Core-Flow Cytometry
Email: mwaring@partners.org
Thomas J. Diefenbach, Ph. D.
Associate Director, Imaging Core
Email: tdiefenbach@partners.org
*Brown, Michael, and Carl Wittwer. Flow Cytometry: Principles and Clinical Applications in Hematology. Clinical Chemistry: 46:8(B), 2000. PDF.
 Liam is a lifelong resident of Boston and is currently enrolled at the University of Massachusetts in Amherst majoring in Biochemistry and Molecular Biology on a pre-medical track. In his freshman year at UMass, Liam was elected the House Council President of the UMass Northeast residential area and was selected as one of fifteen members of the inaugural Biology Major Advisory Committee. Last year, Liam authored and published a book titled Through the Eyes of Our Neighbors which explores the differing identities of Boston as it pertains to people of different racial groups, socioeconomic classes, and nationalities through portraits and interviews collected from over 70 people. Liam piloted Through the Eyes of Our Neighbors in a TEDx talk to an audience of over 600. This summer, Liam is working at the Ragon Institute of Mass General, MIT, and Harvard alongside Sarah Sullivan and Dr. Sylvie Le Gall as a liaison between the communications department and research laboratories.